Christian Heilmann

Posts Tagged ‘yql’

Worldinfo – my Event Apart 10KB submission (information and documented source code)

Tuesday, August 17th, 2010

As you might know, an Event Apart in association with Microsoft are currently running a competition asking developers what they can do in under 10KB and I thought I have a shot at that.

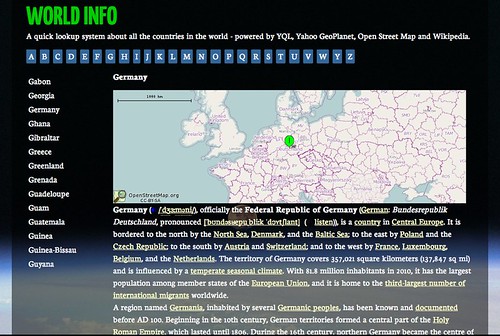
So here’s my submission: an interface to get information about any country on this planet in under 5K:

I got the idea last Thursday during Pub Standards in London when someone asked me if it is possible to get information about all the countries in the world using YQL. The main interest was not only to get the names but also the bounding box information in order to display maps with the right zoom level. And it is, all you need to do in YQL is the following:

select name,boundingBox from geo.places.children(0) where
parent_woeid=1 and placetype=”country” | sort(field=”name”)

This gets all the children of the entry with the WOEID of 1 (Earth, that is) in the GeoPlanet dataset that are a country and sorts them alphabetically for you.

Each of the results comes with bounding box information which you then can use to display a map with the Open Streetmap static image API (or any other provider). For example:

http://pafciu17.dev.openstreetmap.org/?
module=map&bbox=38.804001,37.378052,
48.575699,29.103001&width=500&height=250

Or as I use it:

var image = ‘http://pafciu17.dev.openstreetmap.org/?module=map&bbox=’+
bb.boundingBox.southWest.longitude+’,’+
bb.boundingBox.northEast.latitude+’,’+
bb.boundingBox.northEast.longitude+’,’+
bb.boundingBox.southWest.latitude+
‘&width=500&height=250’;

The last piece to the puzzle was where to get country information from and of course the easiest is Wikipedia. Every country web site in Wikipedia has a info table about it which turned out to be too much of a pain to clean up so all I did was to scrape the first three paragraphs following this table with YQL:

select * from html where
url=”http://en.wikipedia.org/wiki/Christmas_Islands”
and xpath=”//table/following-sibling::p” limit 3

The rest, as they say, is history. I built the system in all in all 2 hours and now I spent some time to clean it up and spice it up:

World Info - my 10kb app compo entry (spiced up source version) by photo

As the first loading of the data takes a long time I use HTML5 local storage to cache the country information. This means you only have to wait once and subsequently it’ll be much faster.

You can download and see the source of Worldinfo on GitHub and read through the massive amount of comments I left for you.

If I were to build this as a real product I would cache the results on a server rather than hammering the APIs every time a user comes along – as the information doesn’t change much this makes much more sense. I will probably release a PHP version of that soon. For now, this is what we have.

Adding a world globe and location information to your site with YQL

Sunday, August 1st, 2010

Whilst looking around the open tables in YQL I found a table with earthquake information released by the United States Geological Survey. One thing the RSS feeds returned from that service had was quite a cool picture of Earth with the location as a star:

Example of the globes rendered by the USGS web service

Looking at the source I realised that the image URL has a certain logic to it:

http://earthquake.usgs.gov/images/globes/50_40.jpg

The first number is the latitude, the second the longitude of the location. Each of them need to be multiples of 5 to result in an image. Try it out by changing the values.

Using this, I put together an open YQL table to render some HTML that shows a the globe image and the information the Yahoo GeoPlanet web service has available about that location.

You can use the table with the following YQL statement:

select * from geo.globeimage where place=”sfo” and type=”data” and location=”true”

Open this in the console here or see the results as XML.

The different parameters are:

place
The geographical location, like SFO for San Francisco Airport or London, UK for London, England
type
the type of the image. If you provide data as the parameter the image gets returned as inline data. This renders the badge much faster as the image doesn’t need to get loaded from the USGS server.
location
A Boolean if want to show the list of location information or not

The above statement would render the following HTML:


sfo

  • Name: San Francisco International Airport

  • Placetype: Airport

  • Country: United States

  • Latitude: 37.614761

  • Longitude: -122.391876

  • WOEID: 12521721

In order to use this without going through YQL, I’ve put together a small JavaScript:

globebadge.init({
element:’ID or reference of element to add the badge to‘,
location:’the geographical location you want to show‘,
showlist:true or false – if set to true the script displays the place information as an HTML list.
});

For example:

globebadge.init({
element:’badge’,
location:’Batman’,
showlist:true
});

This will render in your browser like the following image:

globebadge

You can find the source of the badge script on GitHub:

Notice that I am testing for the browser. If we have IE6 I do not return the image as a data URI, otherwise I do.

If you want to see it in action and try it out with a few locations, check out the demo page for Geoglobes.

You can see the globeimage open table for YQL at the YQL table repository:

Another example how you can find cool stuff and then turn it into a web service with YQL :)

The Hackday Toolbox – getting you started faster

Thursday, July 29th, 2010

Just having spent a lot of time at the amazing open hack day in Bangalore, India I found that most of the questions about starting a hack using Yahoo technology revolved around a few issues:

  • How do I access data on the web/from web services?
  • How do I use YQL from JavaScript or PHP?
  • How do I display information I received from YQL with PHP or JavaScript?
  • How do I get the location of the user and how do I analyse content for geographical locations?
  • How do I access oAuth authenticated information of Yahoo?
  • How do I set up PHP and where can I see errors?

So, to avoid having to repeat myself again I put together The Hackday Toolbox which contains sample code that deals with all these issues.

The Hackday Toolbox

The hackday toolbox contains:

  • An introduction to installing and using PHP with MAMP/XAMPP and debugging it
  • YQLGeo for all your geo and location needs
  • Demos of querying YQL in JavaScript, YUI3 and PHP
  • Demos to display YQL data
  • Authenticated example to access the Yahoo Firehose
  • Rendering Yahoo Geoplanet data as a map

You can download the Hackday Toolbox on GitHub or try the examples.

The toolbox is BSD licensed, so if you want to add Java/Ruby/Python/Heskell/Pascal/Logo/Fortran/6502 Assembly code examples, please do so.

I put my hack in a box…

Geo this! A Chrome plug-in to turn any web site into a map

Wednesday, July 21st, 2010

I’ve just started playing with Google Chrome Extensions heavily inspired by Mark Wubben’s talk at SWDC and of course the first thing I build is something to do with geographical locations.

Geo This! adds a little Earth icon to Chrome that, when pressed, analyses the page and shows a map of the locations it found in the text. If you highlight a part of the page first you only get the locations in this section. Click the screenshot below to go to the download site:

Geo This! A chrome plugin to turn any web site (or highlighted text) into a map

You can also see the extension in action in the following screencast:

Under the hood the extension is more or less a port of my addmap.js hack which in turn works most of its magic by using Yahoo Placemaker and YQL. The source code of the extension is available on GitHub.

Things that will come in future versions are:

  • Fixing the problem that Google Maps only numbers the first 10 markers on the static maps APIv1.0
  • More details on the found locationsv1.0
  • Ability to save the map and locations as an image
  • Better icons (anyone can paint me one?) – right now I am using one of the Project Icons by Mihaiciuc Bogdan and cruelly resized it in Skitch

What do you think?

Analyzing the FIFA2010 worldcup with Guardian Data and YQL

Wednesday, July 14th, 2010

Breaking news: The Guardian once again involved in committing a data awesome! As before, the UK newspaper graced developers with a really cool piece of information published on the web: all the World Cup 2010 statistics as an Excel Sheet.

Now, the easiest way to play with this data is to use YQL, so I simply took a copy of the information and shared it as a CSV document on Google Docs. That way I can use it in YQL:

select * from csv where url=”http://spreadsheets.google.com/pub?
key=0AhphLklK1Ve4dEdrWC1YcjVKN0ZRbTlHQUhaWXBKdGc&single=true&gid=1&x=1&
output=csv” and columns=”surname,team,position,time,shots,passes,tackles,saves”

You can Try this out in the console and see the results here.

Using YQL to filter and sort this, you can do some interesting searches on that information. For example:

What were the German mid field Players?

select * from csv where url=”http://spreadsheets.google.com/pub?
key=0AhphLklK1Ve4dEdrWC1YcjVKN0ZRbTlHQUhaWXBKdGc&single=true&gid=1&x=1&
output=csv” and columns=”surname,team,position,time,shots,passes,tackles,saves”
and team=”Germany” and position=”Midfielder”

You can Try this out in the console and see the results here.

Using sort() and reverse() you can do rankings. For example:

Who was the goalkeeper with the most saves?

(Neuner of Germany, Kingson of Ghana and Enyeama of Nigeria in case you wonder)

select * from csv where url=”http://spreadsheets.google.com/pub?
key=0AhphLklK1Ve4dEdrWC1YcjVKN0ZRbTlHQUhaWXBKdGc&single=true&gid=1&x=1&
output=csv” and
columns=”surname,team,position,time,shots,passes,tackles,saves”
and position=”Goalkeeper” | sort(field=”saves”) | reverse()

You can Try this out in the console and see the results here.

Which was the player that spent most time on the pitch?

select * from csv where url=”http://spreadsheets.google.com/pub?
key=0AhphLklK1Ve4dEdrWC1YcjVKN0ZRbTlHQUhaWXBKdGc&single=true&gid=1&
output=csv” and
columns=”surname,team,position,time,shots,passes,tackles,saves”
| sort(field=”time”) | reverse()

You can Try this out in the console and see the results here.

Who were the players who were the least on the pitch in the German and Brazilian teams?

select * from csv where url=”http://spreadsheets.google.com/pub?
key=0AhphLklK1Ve4dEdrWC1YcjVKN0ZRbTlHQUhaWXBKdGc&single=true&gid=1&x=1&
output=csv” and columns=”surname,team,position,time,shots,passes,tackles,saves”
and team in (“Germany”,”Brazil”) | sort(field=”time”)

You can Try this out in the console and see the results here.

Using the CSV output and YQL you can do all kind of cool things with that data – as YQL also releases it as JSON it makes it easy to create interactive interfaces and visualizations, too – why don’t you have a go?